Circlage: Surgeon Flow
Designing a Video Based AI Mentor Tool for Surgeons at Johns Hopkins Hospital | B2B SaaS Web App Design
My Role
-
Primary UX Designer.
-
Research and Coordination with the Stakeholder's ML Team to Understand the Capabilities & Limitations of the AI.
-
User Testing.
Tools
Figma, Microsoft Office, Jira, Otter.ai
Timeline
7 weeks
Team

Cindy Brummer
Project Lead

Andy Brummer
Developer

Vibha Hegde
Designer
Background
Circlage, a cloud-based video analysis platform aimed at optimizing surgical care by harnessing artificial intelligence to assess surgeons’ skills and provide them with automated feedback.
When I onboarded the project, we had a quickly designed MVP and an established design system. I started with user testing on this existing design which lead to the redesign.
My Goals & Contributions
-
Establishing clear hierarchy and structure to ensure that the website is easy to navigate to incredibly busy surgeons and residents.
-
User research interviews to empathize and introduce useful AI insights and features for the platform.
-
Validate and iterate the designs through 2 rounds of user testing with 7 surgeons.
-
Revamped the UI by enhancing the design system within the established brand guidelines.

The Problem Space
01
Surgeons and surgical residents lack access to personalized feedback, making it difficult for them to monitor their performance, identify mistakes, and continuously improve their skills.
02
Surgeons and OR administrators rely on multiple platforms to record and monitor data, leading to fragmented information, inefficiencies, and repetitive tasks.
03
There is a mismatch between surgeons' perceived performance metrics and the records maintained by OR administrators, leading to potential disagreements and challenges in aligning performance evaluations.
Product Structure
Circlage is divided into two components and tailored to the needs of each user segment. This allows them to access role specific information but ensures that the shared data is consistent across both segments, preventing discrepancies and improving workflow efficiency.

Early Career Surgeons & Educators

Platform to upload surgical videos which are evaluated by Circlage's AI to give personalized feedback and approved upskilling resources.

Personal notes on video and notes from educators with feedback.
Performance dashboard which tracks metrics, highlights progress and areas for improvement.
User Segment 1:

Operation Room Administrators
Dashboard that tracks surgeon performance metrics and usage of manpower and other surgical resources.

Utilizes Circlage's AI to predict usage and manage operational efficiency.

Data sync between both user segments to improve communication and transparency.
User Segment 2:
Project Timeline

Constraints
01
Established Visual Language
Through the MVP, Circlage had established a color palette and design guide. It was important to stick with it while refining the design guide.
02
Phased Project
The project is broken down into phases, and developments had to be presented to investors at benchmarked steps to continue the funding.
03
Technical Limitations
Product features are limited by what the ML for the product is capable of doing at the moment.
Primary Research & Analysis
I found that our users are...
PRIMARY RESEARCH
How Do Surgeons Learn in the First Place?
We conducted 12 surgeon interviews. We asked them about their current tools, their learning methods and pain points. My goal was to understand how surgeons like to learn, understand user behavior and gain insights on how they will be interacting with the platform.
Motivated By
User Behavior
Limited time and high efficiency needs
They prefer educational materials that are relevant, verified, and organized for quick access
High drive for continuous improvement under pressure for perfection.
They are keen to track their progress, feeling stressed about pinpointing areas for improvement to avoid mistakes.
Strong competitive drive.
Surgeons express a desire to know how their performance compares to their peers and supervisors.
INSIGHTS
What Should We Do?
From the primary research analysis, I outlined the major areas where I wanted to intervene and felt would make a huge impact.
01
Orient the User
-
Welcome the user and subsequently highlight the information that is primarily sought by the user.
-
Use wayfinding and breadcrumb trails.
02
Clear Value Proposition
-
Understand what the users actually want and how they can see themselves using the features.
-
Present the features in a hierarchical, familiar and delightful manner.
03
Structured Work Flow
-
Simplify the screens and create step-wise work flows to make the data easy to consume.
04
Add Positive Reinforcement
-
As a mentoring tool (especially, in a high pressure environment), it is important to add cues of encouragement. From the user interviews, the highly self-critical nature of surgical residents became apparent.
In our iterative design process, we conducted two rounds of user testing with 7 surgeons and surgical residents.


IMPACT
Reduced the Average Time On Task by
60%
The final design iteration showed
Task success rate of 100%
Reduction in User Error Rate by 20%
Design

Before | Mid Fi Wireframe

User Feedback:
-
"Purpose and specifics of the monthly report unclear."
-
"The scoring system is unclear."
-
"I'm probably not going to read an article here."
Design Actions:
-
Established hierarchy and chunking of information and adhering to the "F" reading pattern.
-
Adding appropriate metrics to provide a complete picture.
-
Reducing information overload by creating separate sections for analytics and suggested resources.
Before | Mid Fi Wireframe

User Feedback:
-
"As a first time user, I would like a tutorial."
-
"What is the "Generate Report" button?"
-
I don't understand all the different types of notes options."
Design Actions:
-
Created a de-cluttered, stepwise flow for the notes feature.
-
Changed the label of "Generate Report" to "Evaluate With AI."
After | Hi Fi Wireframe


Before | Mid Fi Wireframe

User Feedback:
-
"I'm not sure what the notes here are - are they AI generated or from the surgeon?"
-
"How am I being scored?"
Design Actions:
-
Reduced clutter by chunking the step-wise detailed report and the report summary into separate sections.
-
"Well Executed Areas" added to motivate users.
-
"Well Executed Areas" and "Areas for Improvement" scores have a information bubbles that explain the metric.
After | Hi Fi Wireframe


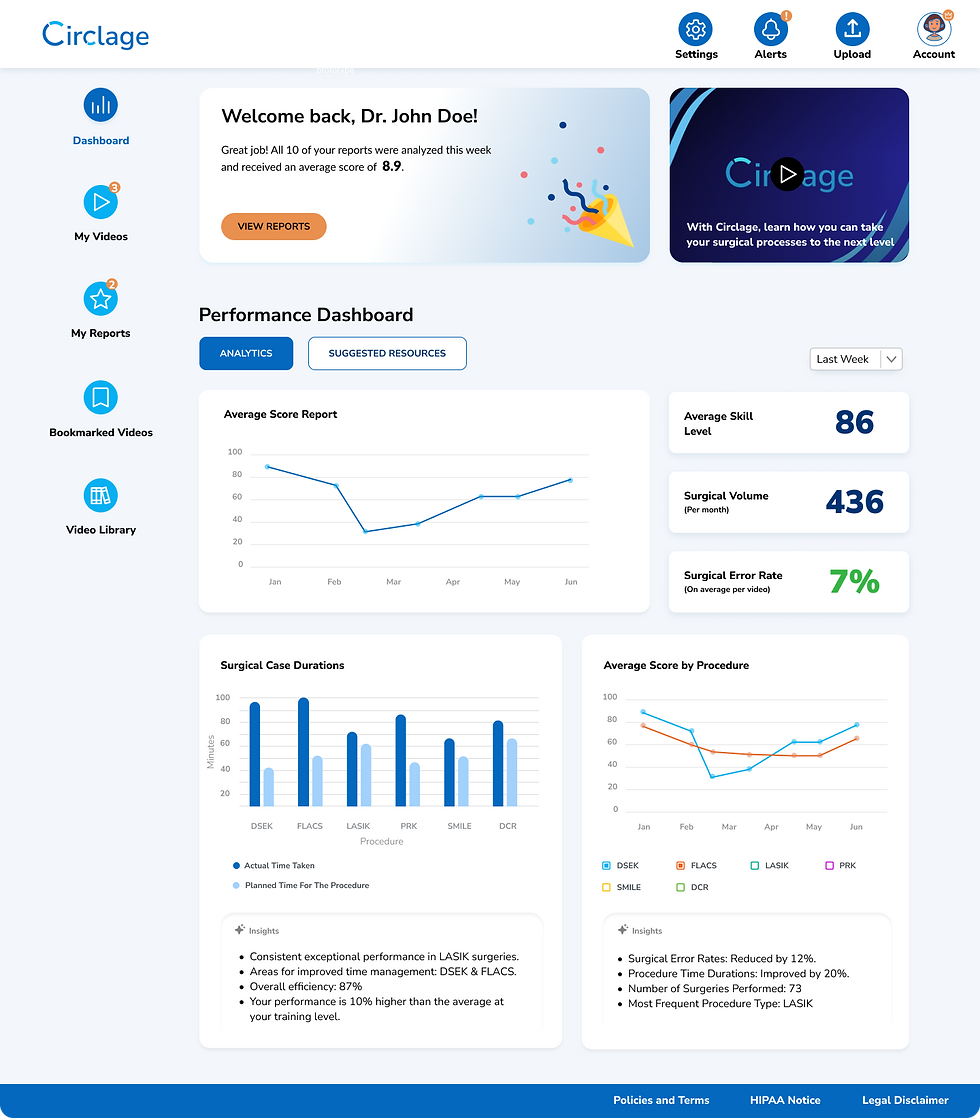
01
DESIGNING
User Dashboard
Updating the Existing Design System according to Industry Standards


.png)
MY LEARNINGS
My First UX Project as the Primary Designer
From the primary research analysis, I outlined the major areas where I wanted to intervene and felt would make a huge impact.
01
Anticipating Needs
-
By asking the right questions early, I was able to anticipate potential challenges and opportunities.
-
Thinking ahead helps create a more user-centric and future-proof design.
02
Taking the Lead
-
Although it was out of my initial scope, I took the initiative to modernize the style guide within budget constraints, ensuring a more cohesive and scalable design system.
-
This initiative improved user first impression by 100%.
03
Value of End-To-End Involvement
-
Being directly involved in user research helped me make more informed and user-focused design decisions ie., picking up on facial expressions during user interviews helped me gain deeper understanding.
-
I was able to provide strategic feature recommendations based on insights from the research and iterative design process.
02
DESIGNING
Notes
03
DESIGNING
AI Generated Feedback Report
.png)

